District-Level Economic Intelligence for Live Events
See exactly how events drive your city's economy — from venue impact to district
spending to tax revenue.
District by district.
See exactly how events drive your city's economy — from venue impact to district
spending to tax revenue.
District by district.
The Problem
Economic impact is measured city-wide, missing the district-level story that drives real investment decisions.
When a festival pitches your city, there's no way to project the economic ripple effect before saying yes.
Stakeholders need district-specific data with spending breakdowns, not vague city-wide summaries.
The Product
Priveo maps every venue's economic footprint, aggregates it by district, and lets you model scenarios — all on one interactive platform.
Features
Three workflows that match how CVB directors actually make decisions.
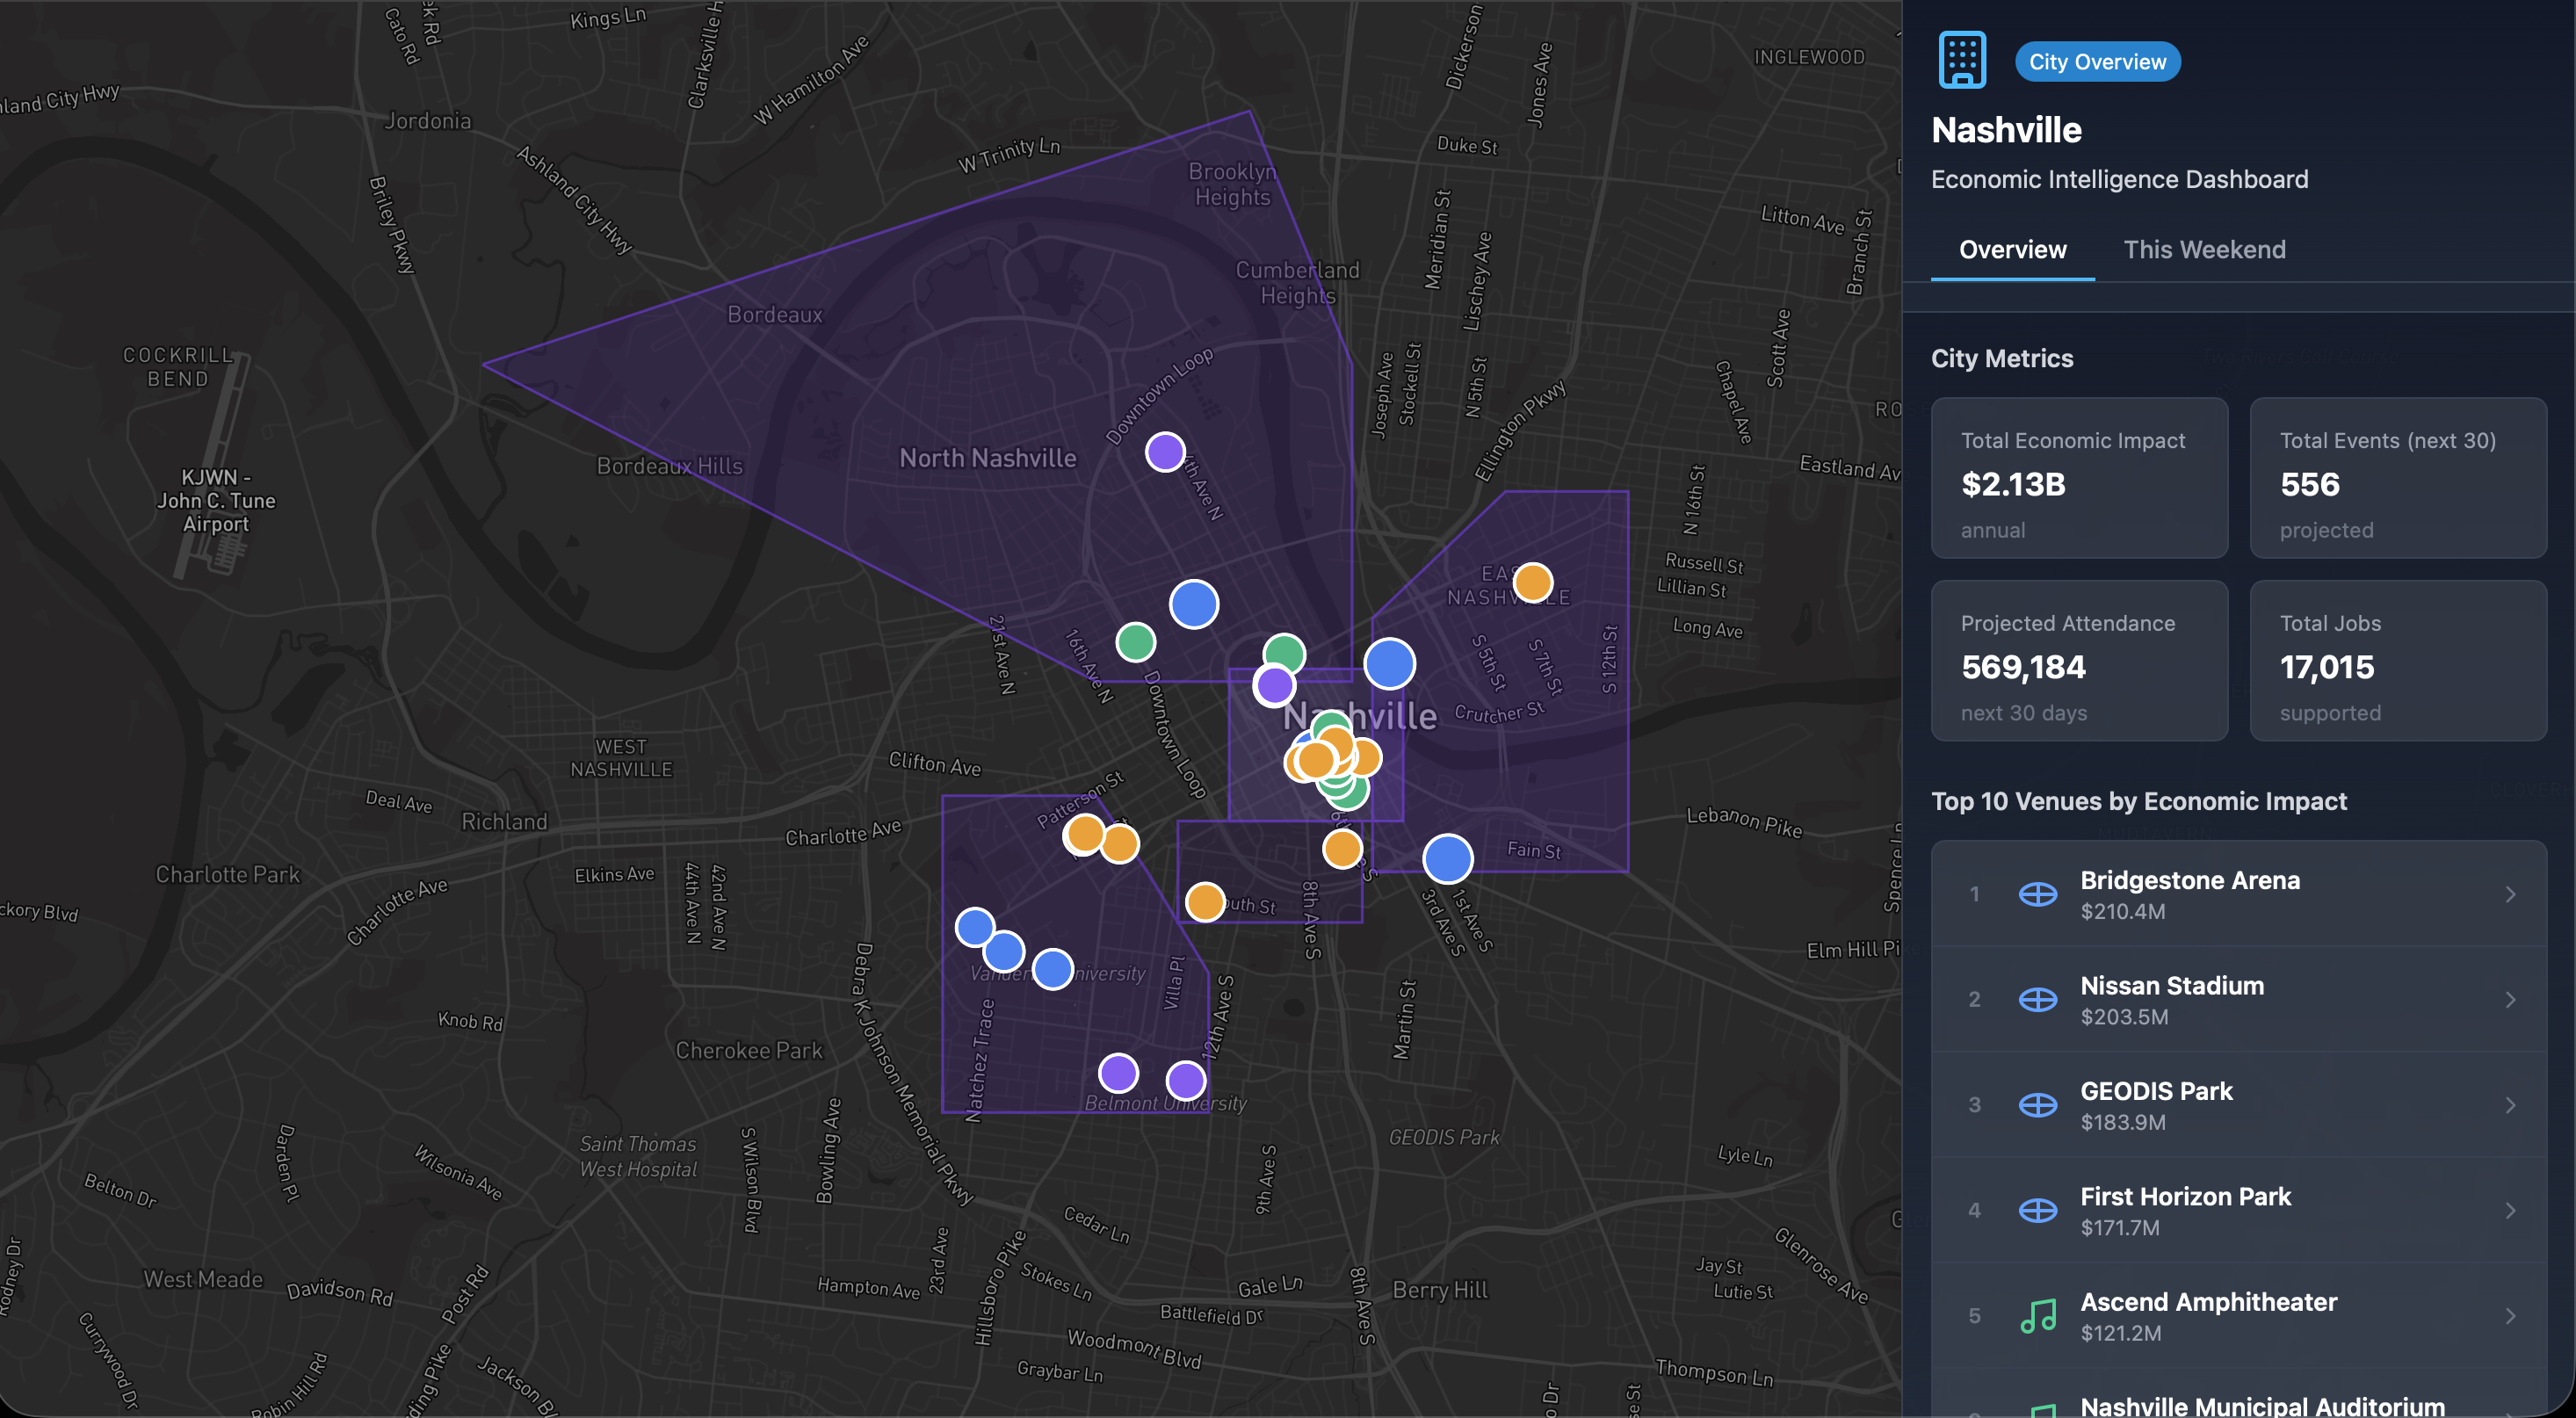
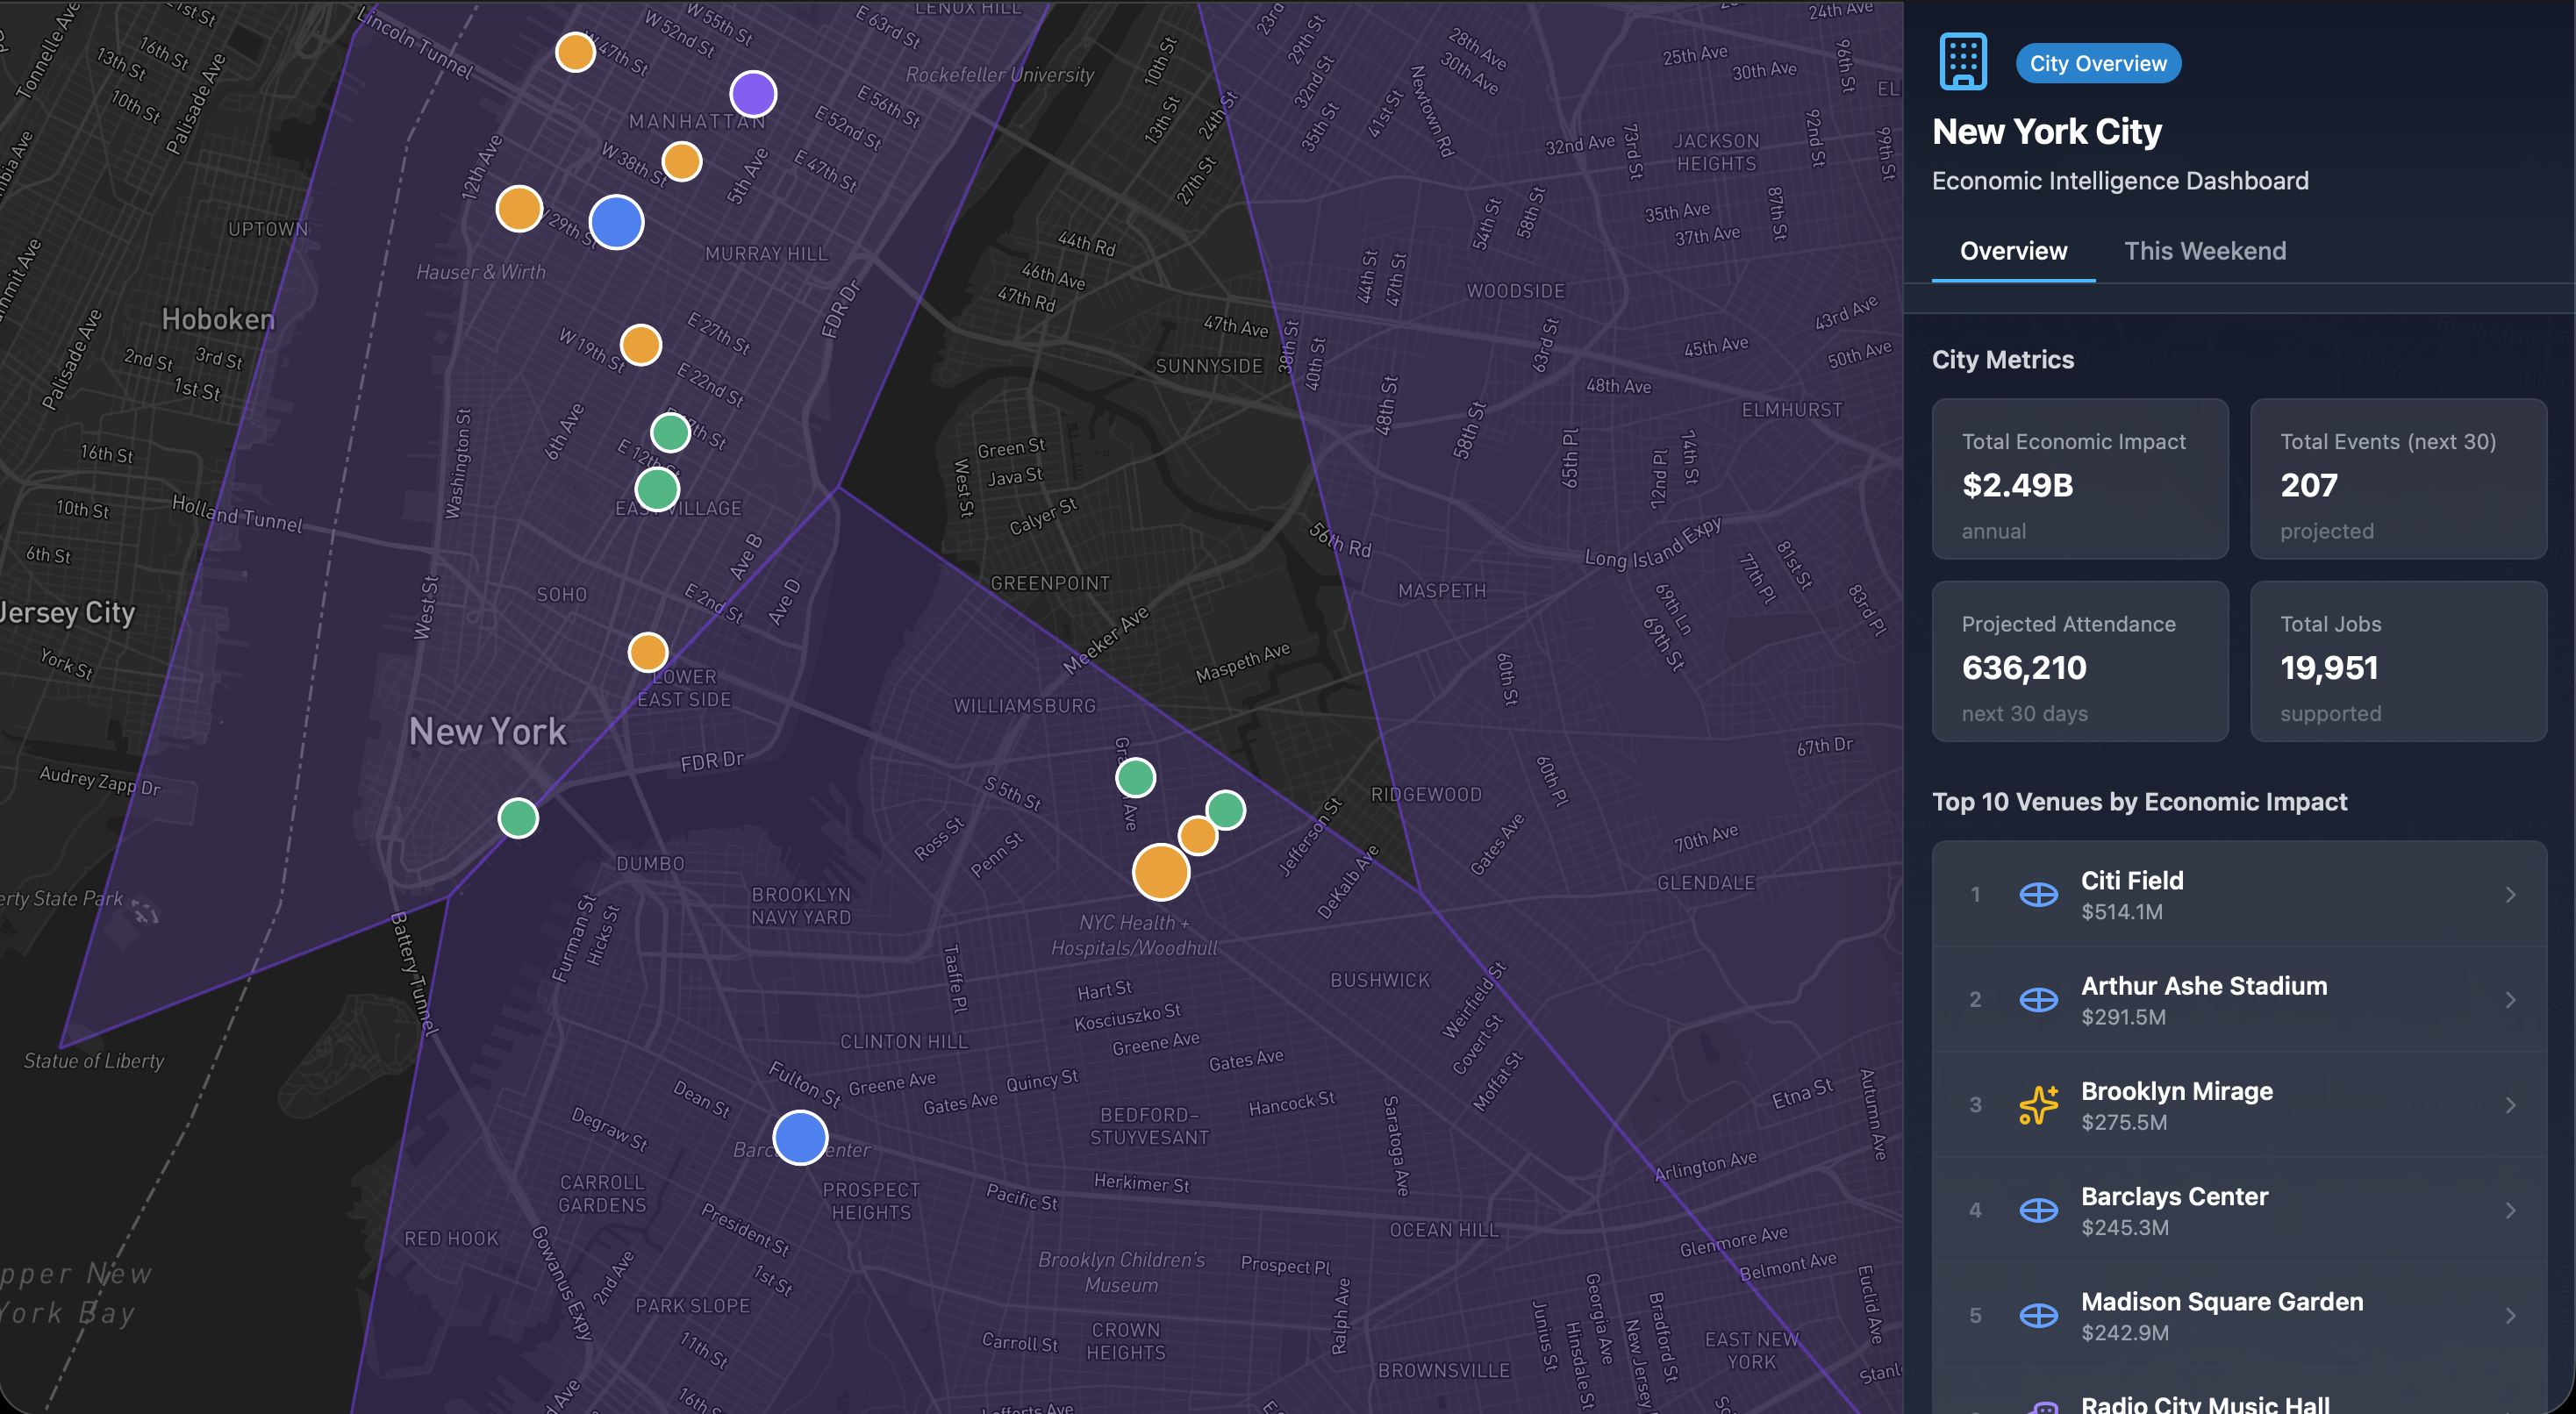
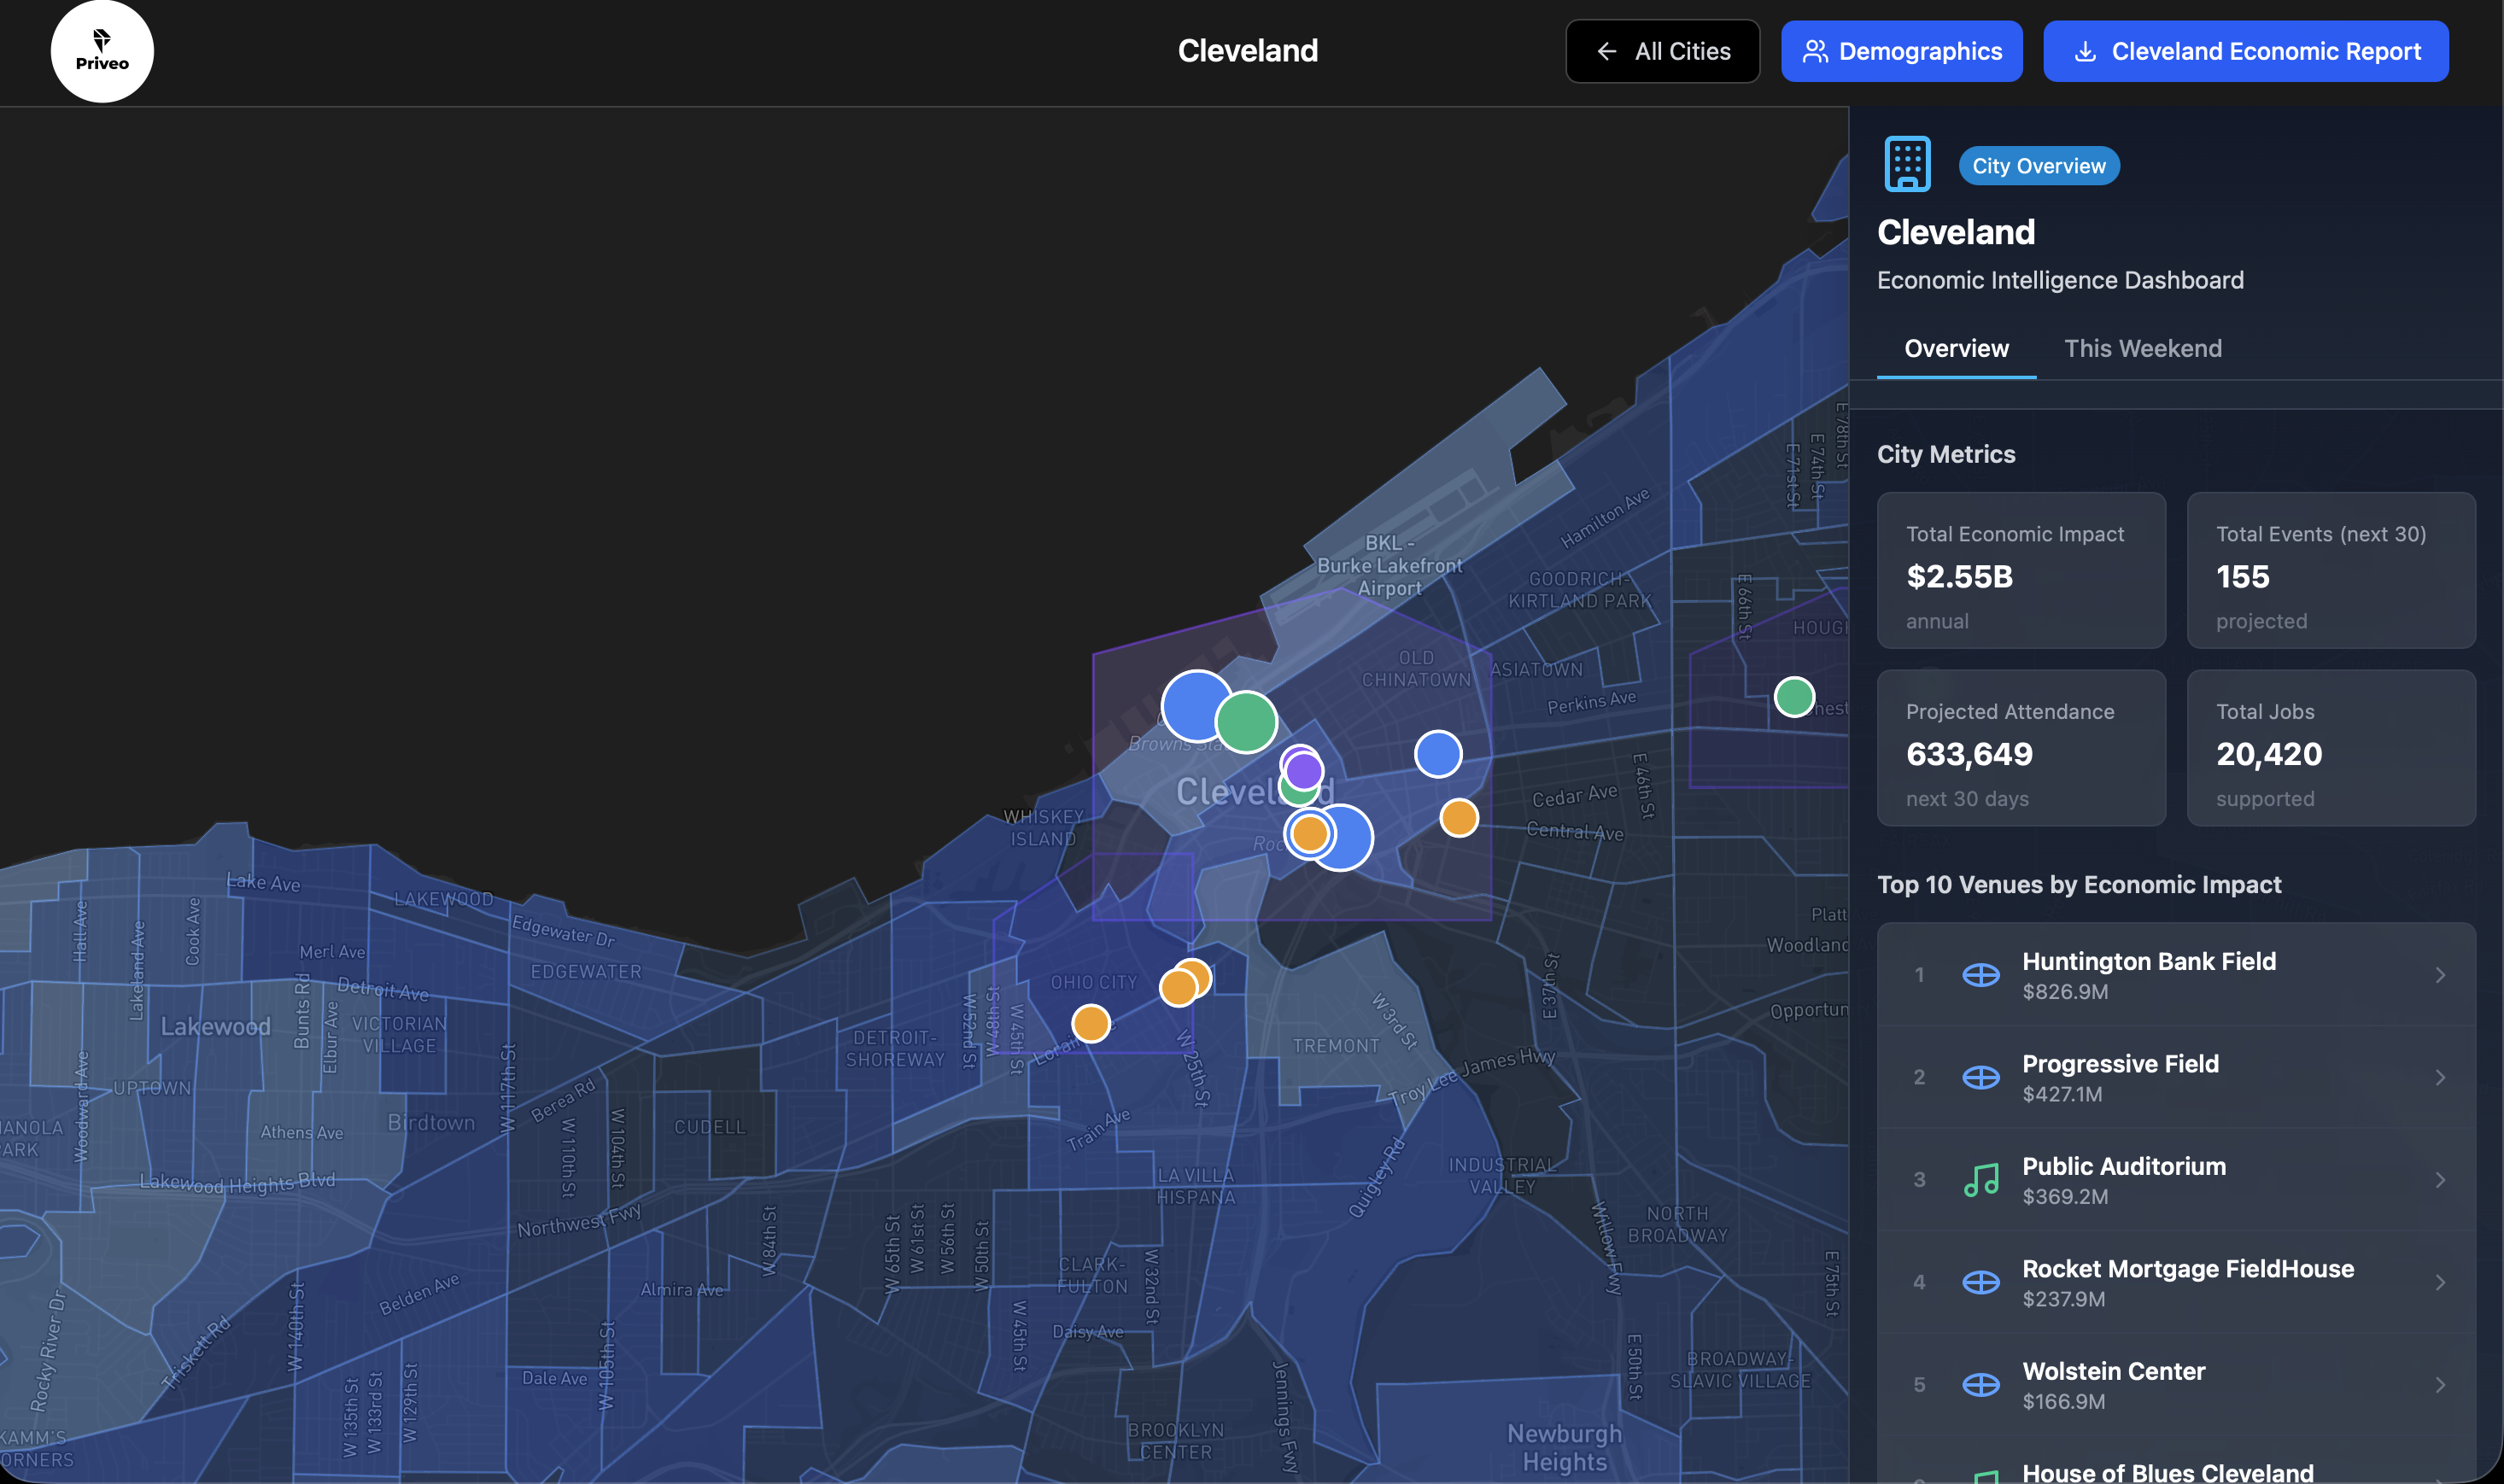
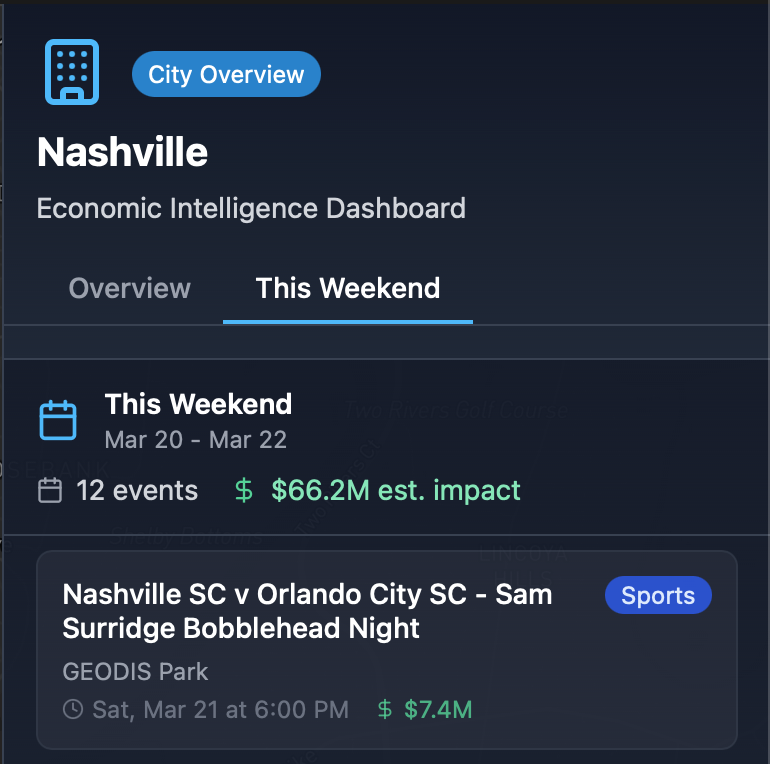
Live Intelligence
Live event data from Ticketmaster, automatically scored for economic impact. See total events, estimated spending, and venue-level detail for the days ahead.
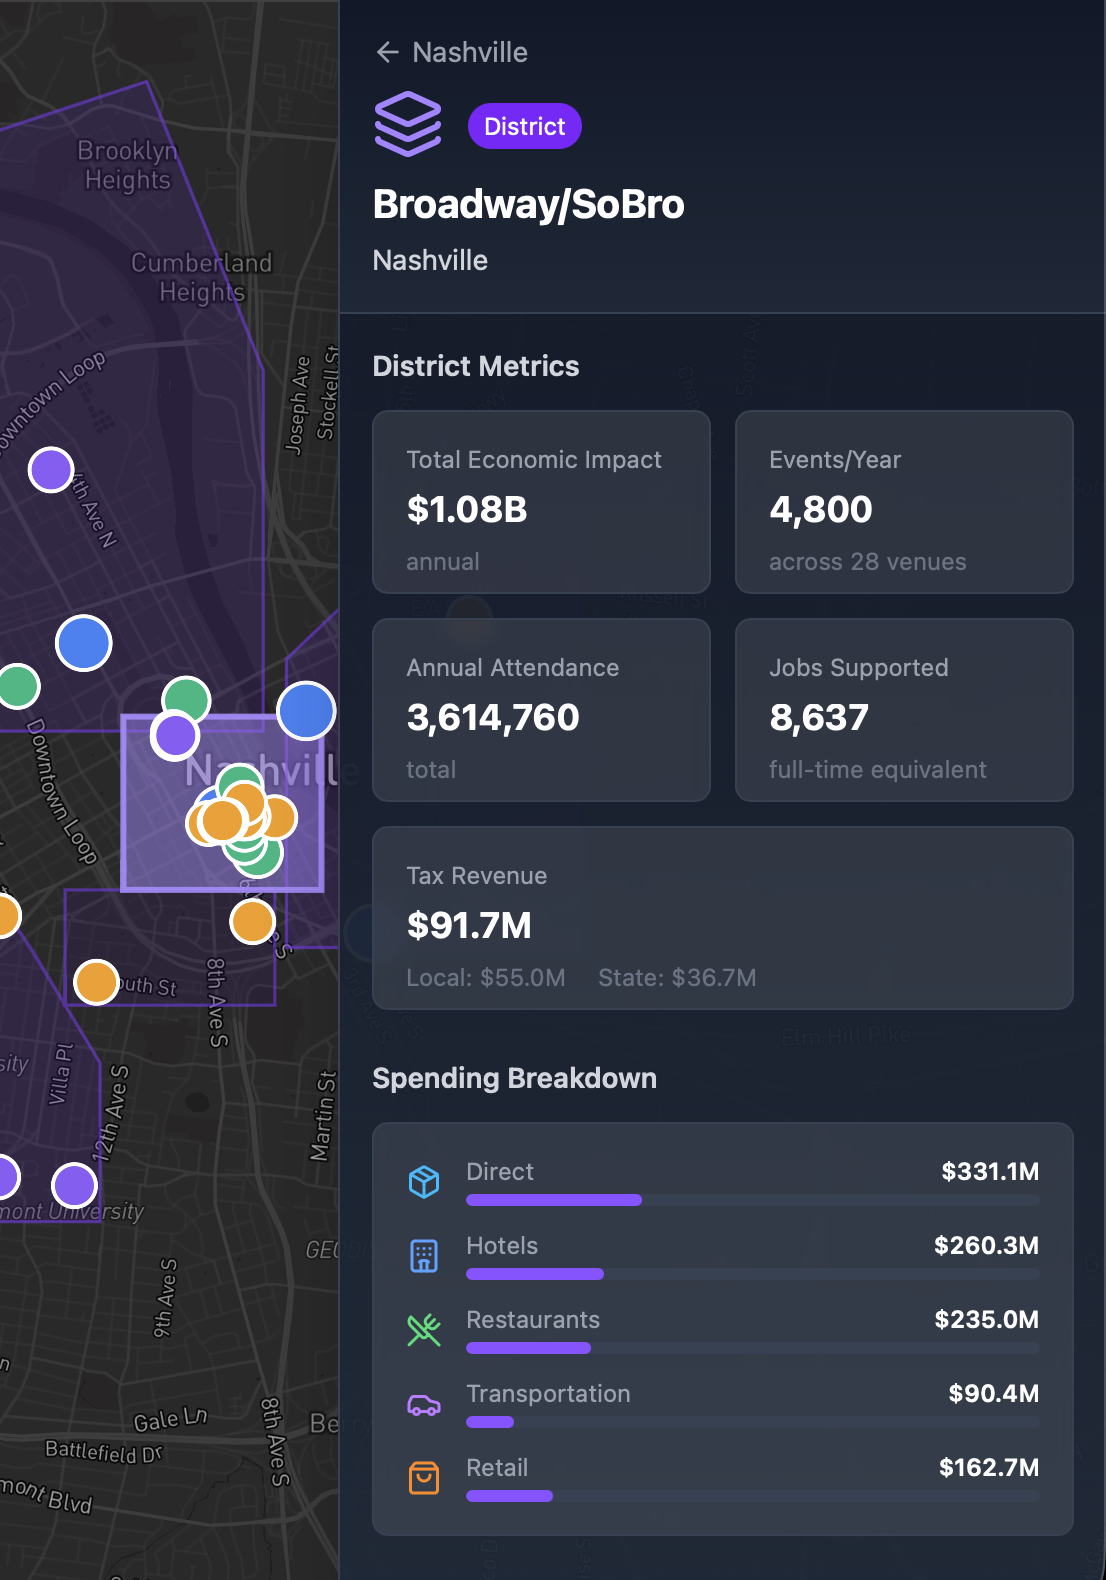
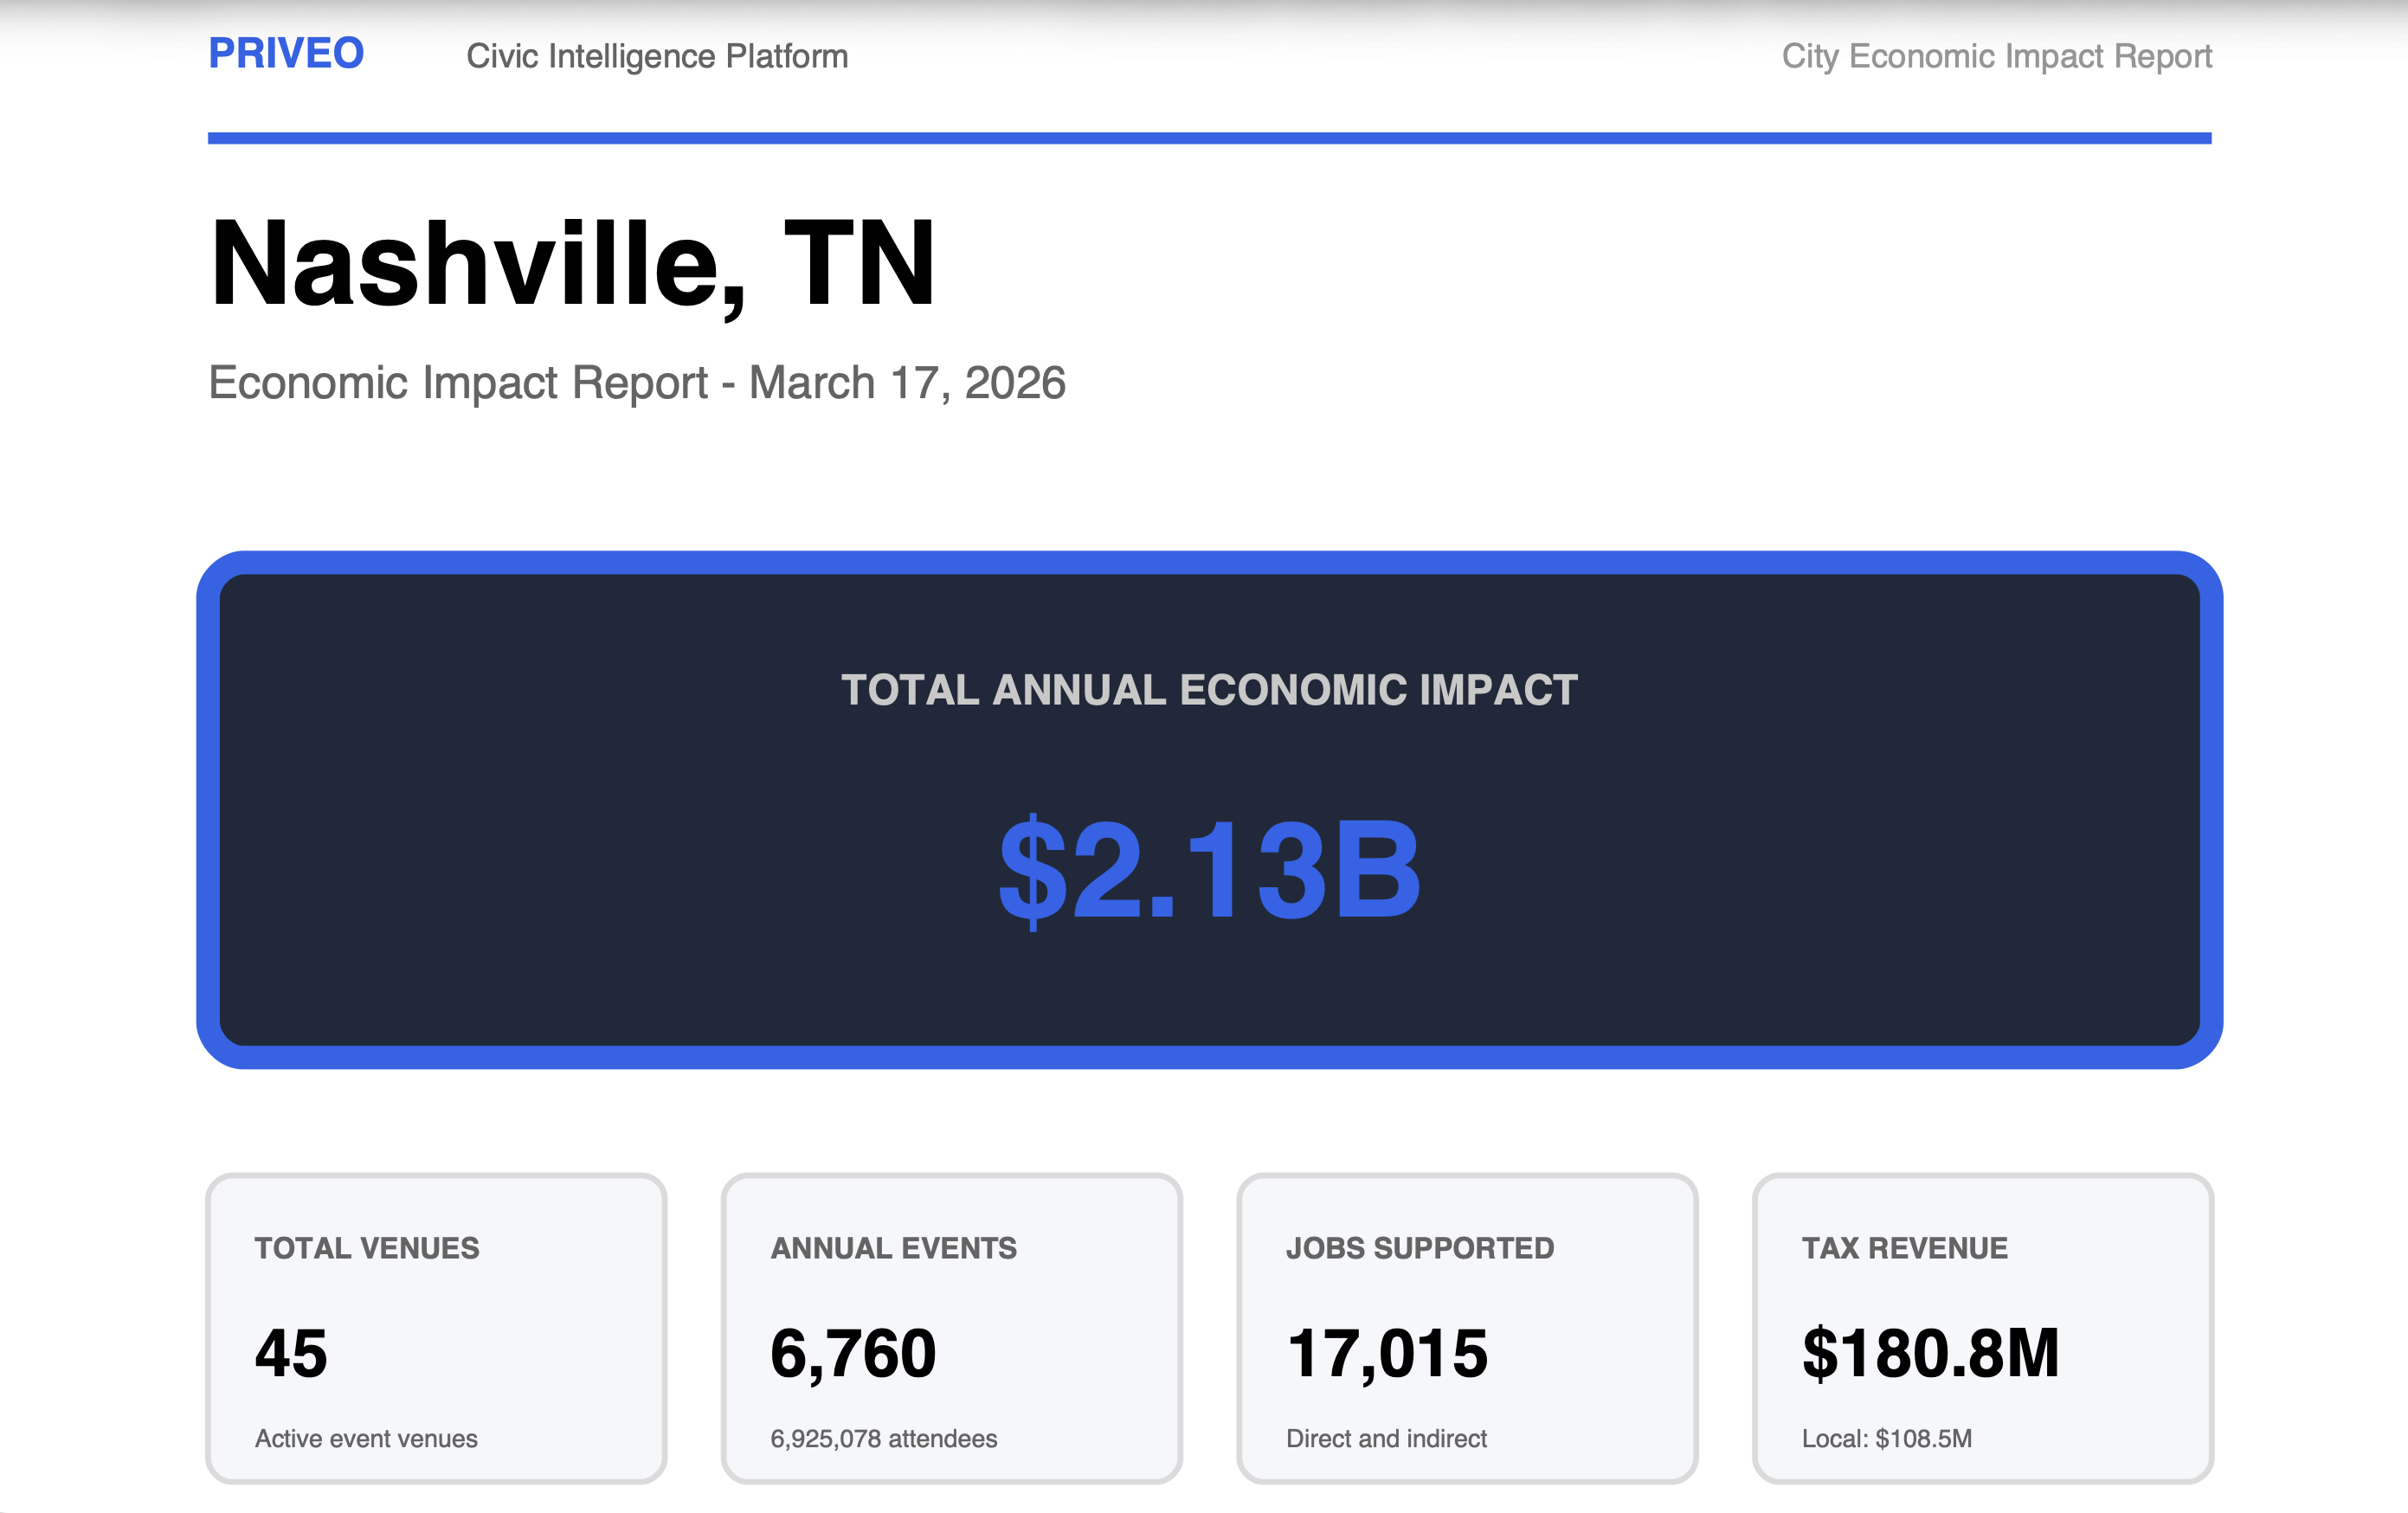
Reporting
Professional city economic reports and district briefs with district breakdowns, spending analysis, venue tables, and tax revenue detail. Export as PDF in one click.
Use Cases
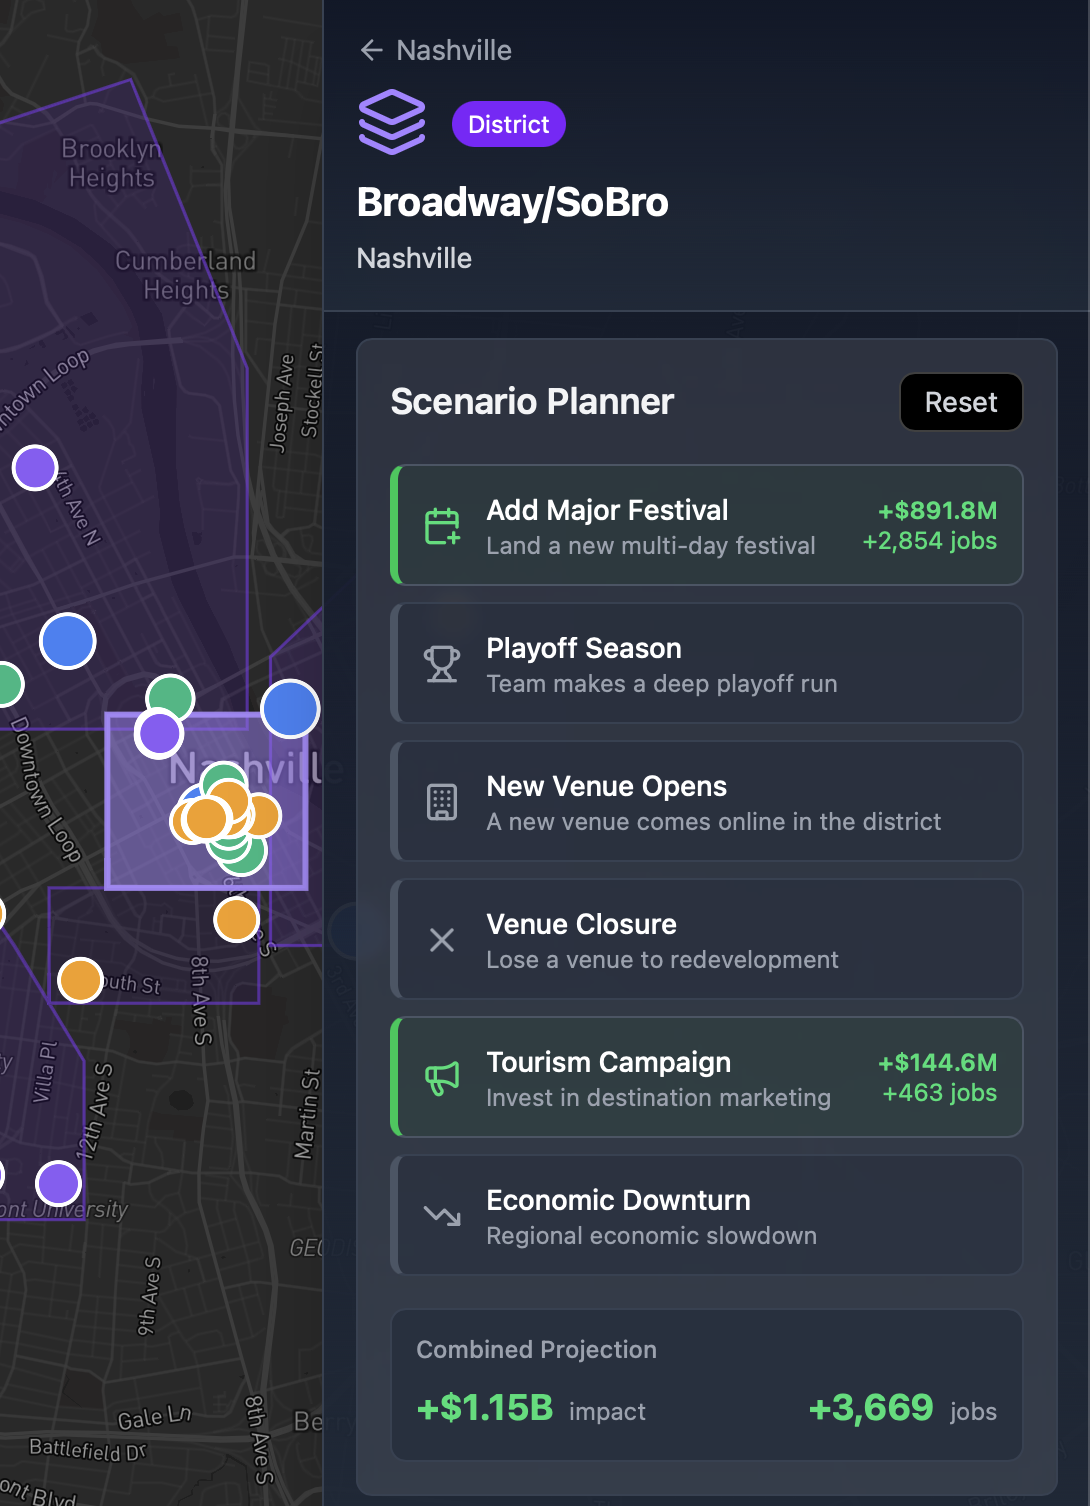
Justify event investment with district-level economic data. Model what landing a new festival means for jobs, tax revenue, and local spending.
Quantify the ripple effect of live events on districts. Export reports that make the case for funding and infrastructure investment.
See exactly what your district generates — from Broadway/SoBro to Manhattan. Compare performance, track outcomes, brief your board.
Data-driven budget decisions backed by venue-level economics. See where events create jobs, where tax revenue flows, and where to invest next.
Request early access and we'll show you what
Priveo reveals about your districts.